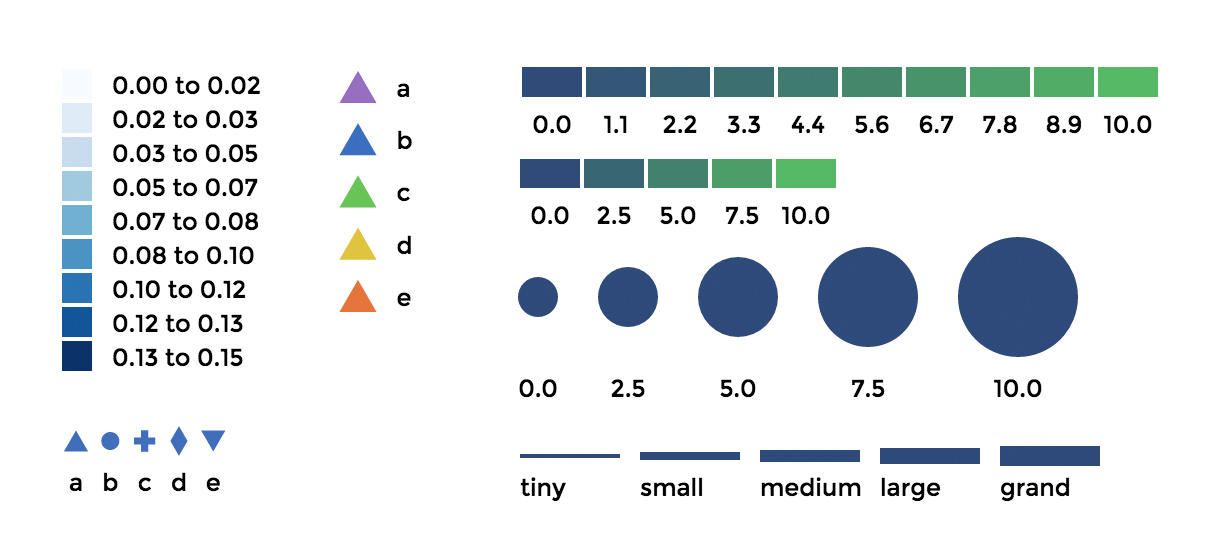
Tired of making legends for your data visualizations? Me too, enjoy.
A library to make legends in svg-land easy as pie.
By Susie Lu
You can add latest version of d3-legend compatible with d3v3 hosted on cdnjs.
https://cdnjs.com/libraries/d3-legend/1.13.0
You must include the d3 library before including the legend file. Then you can simply add the compiled js file to your website:
You can add the d3 legend as a node module by running:
npm install --save d3-svg-legend@1.x
The full source code is available on github. I would love to hear from you about any additional features that would be useful, please say hi on twitter @DataToViz.
Summary of Functions - table of which functions are shared across legend types
d3.legend.color()
Constructs a new color legend. The legend component expects a d3 scale as the basic input, but also has a number of optional parameters for changing the default display such as vertical or horizontal orientation, shape of the symbol next to the label, symbol sizing, and label formatting.
color.scale(d3.scale)
Creates a new d3 legend based on the scale. The code determines the type of scale and generates the appropriate symbol and label pairs.
color.cells(number or [numbers])
This parameter is only valid for continuous scales (like linear and log). When there is no indication from the domain or range for the number of steps in the legend you may want to display, it defaults to five steps in equal increments. You can pass the cells function a single number which will create equal increments for that number of steps, or an array of the specific steps you want the legend to display.
color.orient(string)
Accepts "vertical" or "horizontal" for legend orientation. Default set to "vertical."
color.ascending(boolean)
If you pass this a true, it will reverse the order of the scale.
color.shape(string[, path-string])
Accepts "rect", "circle", "line", or "path". If you choose "path," you must also pass a second parameter as a path string. Defaults to "rect." An example: Color - Ordinal Scale Legend, custom shape.
color.shapeWidth(number)
Only applies to shape of "rect" or "line." Default set to 15px.
color.shapeHeight(number)
Only applies to shape of "rect." Default set to 15px.
color.shapeRadius(number)
Only applies to shape of "circle." Default set to 10px.
color.shapePadding(number)
Applies to all shapes. Determines vertical or horizontal spacing between shapes depending on the respective orient setting. Default set to 2px.
color.useClass(boolean)
The default behavior is for the legend to set the fill of the legend's symbols (except for the "line" shape which uses stroke). If you set useClass to true
then it will apply the scale's output as classes to the shapes instead of the fill or stroke. An example: Color - Quantile Scale Legend.
color.classPrefix(string)
Adds this string to the beginning of all of the components of the legend that have a class. This allows for namespacing of the classes.
color.title(string)
Sets the legend's title to the string. Automatically moves the legend cells down based on the size of the title. An example: Symbol - Ordinal Scale.
color.labels([string])
Sets the legend labels to the array of strings passed to the legend. If the array is not the same length as the array the legend calculates, it merges the values and gives the calculated labels for the remaining items. An example: Size - Linear Scale Legend, Lines.
color.labelAlign(string)
Only used if the legend's orient is set to "horizontal." Accepts "start", "middle", or "end" as inputs to determine if the labels are aligned on the left, middle or right under the symbol in a horizontal legend. An example: Size - Linear Scale Legend, Lines.
color.labelFormat(d3.format)
Takes a d3.format and applies that styling to the legend labels. Default is set to d3.format(".01f")
.
color.labelOffset(number)
A value that determines how far the label is from the symbol in each legend item. Default set to 10px.
color.labelDelimiter(string)
Change the default "to" text when working with a quant scale.
color.on(string, function)
There are three custom event types you can bind to the legend: "cellover", "cellout", and "cellclick" An exampe: Symbol - Ordinal Scale
var quantize = d3.scale.quantize()
.domain([ 0, 0.15 ])
.range(d3.range(9).map(function(i) { return "q" + i + "-9"; }));
var svg = d3.select("svg");
svg.append("g")
.attr("class", "legendQuant")
.attr("transform", "translate(20,20)");
var legend = d3.legend.color()
.labelFormat(d3.format(".2f"))
.useClass(true)
.scale(quantize);
svg.select(".legendQuant")
.call(legend);
var log = d3.scale.log()
.domain([ 0.1, 100, 1000 ])
.range(["rgb(46, 73, 123)", "rgb(71, 187, 94)"]);
var svg = d3.select("svg");
svg.append("g")
.attr("class", "legendLog")
.attr("transform", "translate(20,20)");
var logLegend = d3.legend.color()
.cells([0.1, 5, 10, 50, 100, 500, 1000])
.scale(log);
svg.select(".legendLog")
.call(logLegend);
var linear = d3.scale.linear()
.domain([0,10])
.range(["rgb(46, 73, 123)", "rgb(71, 187, 94)"]);
var svg = d3.select("svg");
svg.append("g")
.attr("class", "legendLinear")
.attr("transform", "translate(20,20)");
var legendLinear = d3.legend.color()
.shapeWidth(30)
.orient('horizontal')
.scale(linear);
svg.select(".legendLinear")
.call(legendLinear);
var linear = d3.scale.linear()
.domain([0,10])
.range(["rgb(46, 73, 123)", "rgb(71, 187, 94)"]);
var svg = d3.select("svg");
svg.append("g")
.attr("class", "legendLinear")
.attr("transform", "translate(20,20)");
var legendLinear = d3.legend.color()
.shapeWidth(30)
.cells(10)
.orient('horizontal')
.scale(linear);
svg.select(".legendLinear")
.call(legendLinear);
var linear = d3.scale.linear()
.domain([0,10])
.range(["rgb(46, 73, 123)", "rgb(71, 187, 94)"]);
var svg = d3.select("svg");
svg.append("g")
.attr("class", "legendLinear")
.attr("transform", "translate(20,20)");
var legendLinear = d3.legend.color()
.shapeWidth(30)
.cells([1, 2, 3, 6, 8])
.orient('horizontal')
.scale(linear);
svg.select(".legendLinear")
.call(legendLinear);
var ordinal = d3.scale.ordinal()
.domain(["a", "b", "c", "d", "e"])
.range([ "rgb(153, 107, 195)", "rgb(56, 106, 197)", "rgb(93, 199, 76)", "rgb(223, 199, 31)", "rgb(234, 118, 47)"]);
var svg = d3.select("svg");
svg.append("g")
.attr("class", "legendOrdinal")
.attr("transform", "translate(20,20)");
var legendOrdinal = d3.legend.color()
//d3 symbol creates a path-string, for example
//"M0,-8.059274488676564L9.306048591020996,
//8.059274488676564 -9.306048591020996,8.059274488676564Z"
.shape("path", d3.svg.symbol().type("triangle-up").size(150)())
.shapePadding(10)
.scale(ordinal);
svg.select(".legendOrdinal")
.call(legendOrdinal);
d3.legend.size()
Constructs a new size legend. The legend component expects a d3 scale as the basic input, but also has a number of optional parameters for changing the default display such as vertical or horizontal orientation, shape of the symbol next to the label, symbol sizing, and label formatting.
size.scale(d3.scale)
Creates a new d3 legend based on the scale. The code determines the type of scale and generates the different symbol and label pairs. Expects a scale that has a numerical range.
size.cells(number or [numbers])
This parameter is only valid for continuous scales (like linear and log). When there is no indication from the domain or range for the number of steps in the legend you may want to display, it defaults to five steps in equal increments. You can pass the cells function a single number which will create equal increments for that number of steps, or an array of the specific steps you want the legend to display.
size.orient(string)
Accepts "vertical" or "horizontal" for legend orientation. Default set to "vertical."
size.ascending(boolean)
If you pass this a true, it will reverse the order of the scale.
size.shape(string)
Accepts "rect", "circle", or "line". Defaults to "rect." The assumption is that the scale's output will be used for the width and height if you select "rect," the radius if you select "circle," and the stroke-width if you select "line." If you want to have a custom shape of different sizes in your legend, use the symbol legend and make each path string for the sizes you want as the range array.
size.shapeWidth(number)
Only applies to shape "line." Default set to 15px.
size.shapePadding(number)
Applies to all shapes. Determines vertical or horizontal spacing between shapes depending on the respective orient setting. Default set to 2px.
size.classPrefix(string)
Adds this string to the beginning of all of the components of the legend that have a class. This allows for namespacing of the classes.
size.title(string)
Sets the legend's title to the string. Automatically moves the legend cells down based on the size of the title. An example: Symbol - Ordinal Scale.
size.labels([string])
Sets the legend labels to the array of strings passed to the legend. If the array is not the same length as the array the legend calculates, it merges the values and gives the calculated labels for the remaining items. An example: Size - Linear Scale Legend, Lines
size.labelAlign(string)
Only used if the legend's orient is set to "horizontal." Accepts "start", "middle", or "end" as inputs to determine if the labels are aligned on the left, middle or right under the symbol in a horizontal legend. An example: Size - Linear Scale Legend, Lines.
size.labelFormat(d3.format)
Takes a d3.format and applies that styling to the legend labels. Default is set to d3.format(".01f")
.
size.labelOffset(number)
A value that determines how far the label is from the symbol in each legend item. Default set to 10px.
size.labelDelimiter(string)
Change the default "to" text when working with a quant scale.
size.on(string, function)
There are three custom event types you can bind to the legend: "cellover", "cellout", and "cellclick" An exampe: Symbol - Ordinal Scale
var linearSize = d3.scale.linear().domain([0,10]).range([10, 30]);
var svg = d3.select("svg");
svg.append("g")
.attr("class", "legendSize")
.attr("transform", "translate(20, 40)");
var legendSize = d3.legend.size()
.scale(linearSize)
.shape('circle')
.shapePadding(15)
.labelOffset(20)
.orient('horizontal');
svg.select(".legendSize")
.call(legendSize);
var lineSize = d3.scale.linear().domain([0,10]).range([2, 10]);
var svg = d3.select("svg");
svg.append("g")
.attr("class", "legendSizeLine")
.attr("transform", "translate(0, 20)");
var legendSizeLine = d3.legend.size()
.scale(lineSize)
.shape("line")
.orient("horizontal")
//otherwise labels would have displayed:
// 0, 2.5, 5, 10
.labels(["tiny", "small", "medium", "large", "grand"])
.shapeWidth(40)
.labelAlign("start")
.shapePadding(10);
svg.select(".legendSizeLine")
.call(legendSizeLine);
d3.legend.symbol()
Constructs a new symbol legend. The legend component expects a d3 scale as the basic input, but also has a number of optional parameters for changing the default display such as vertical or horizontal orientation, shape of the symbol next to the label, symbol sizing, and label formatting.
symbol.scale()
Creates a new d3 legend based on the scale. The code determines the type of scale and generates the different symbol and label pairs. The scale's range will be used as the d-attribute in an svg path for each symbol in the legend.
symbol.cells()
This parameter is only valid for continuous scales (like linear and log). When there is no indication from the domain or range for the number of steps in the legend you may want to display, it defaults to five steps in equal increments. You can pass the cells function a single number which will create equal increments for that number of steps, or an array of the specific steps you want the legend to display.
symbol.orient(string)
Accepts "vertical" or "horizontal" for legend orientation. Default set to "vertical."
symbol.ascending(boolean)
If you pass this a true, it will reverse the order of the scale.
symbol.shapePadding()
Applies to all shapes. Determines vertical or horizontal spacing between shapes depending on the respective orient setting. Default set to 2px.
symbol.classPrefix(string)
Adds this string to the beginning of all of the components of the legend that have a class. This allows for namespacing of the classes.
symbol.title(string)
Sets the legend's title to the string. Automatically moves the legend cells down based on the size of the title. An example: Symbol - Ordinal Scale.
symbol.labels([string])
Sets the legend labels to the array of strings passed to the legend. If the array is not the same length as the array the legend calculates, it merges the values and gives the calculated labels for the remaining items. An example: Size - Linear Scale Legend, Lines.
symbol.labelAlign(string)
Only used if the legend's orient is set to "horizontal." Accepts "start", "middle", or "end" as inputs to determine if the labels are aligned on the left, middle or right under the symbol in a horizontal legend. An example: Size - Linear Scale Legend, Lines.
symbol.labelFormat(d3.format)
Takes a d3.format and applies that styling to the legend labels. Default is set to d3.format(".01f")
.
symbol.labelOffset(number)
A value that determines how far the label is from the symbol in each legend item. Default set to 10px.
symbol.labelDelimiter(string)
Change the default "to" text when working with a quant scale.
symbol.on(string, function)
There are three custom event types you can bind to the legend: "cellover", "cellout", and "cellclick" An exampe: Symbol - Ordinal Scale
var triangleU = d3.svg.symbol().type('triangle-up')(),
circle = d3.svg.symbol().type('circle')(),
cross = d3.svg.symbol().type('cross')(),
diamond = d3.svg.symbol().type('diamond')(),
triangleD = d3.svg.symbol().type('triangle-down')();
//example output of d3.svg.symbol().type('circle')();
//"M0,4.51351666838205A4.51351666838205,4.51351666838205 0 1,1 0,
//-4.51351666838205A4.51351666838205,4.51351666838205 0 1,1 0,4.51351666838205Z"
var symbolScale = d3.scale.ordinal()
.domain(['a','b','c', 'd', 'e'])
.range([ triangleU, circle, cross, diamond, triangleD] );
var svg = d3.select("svg");
svg.append("g")
.attr("class", "legendSymbol")
.attr("transform", "translate(20, 20)");
var legendPath = d3.legend.symbol()
.scale(symbolScale)
.orient("horizontal")
.title("Symbol Legend Title")
.on("cellclick", function(d){alert("clicked " + d);});
svg.select(".legendSymbol")
.call(legendPath);
Function | Color | Size | Symbol |
---|---|---|---|
scale | |||
cells | |||
orient | |||
ascending | |||
shape | |||
shapeWidth | |||
shapeHeight | |||
shapeRadius | |||
shapePadding | |||
useClass | |||
classPrefix | |||
title | |||
labels | |||
labelAlign | |||
labelFormat | |||
labelOffset | |||
labelDelimiter | |||
on |
NOTES
Huge thanks to Elijah Meeks for discussing ideas and encouraging me to complete this project.
The styling and layout of this page is made with another project of mine, minimal-ui.
The fonts on this page are provided by Google Fonts, and created by Julieta Ulanovsky and David Perry.
Using Prism for syntax highlighting.
And of course, thanks d3.js for creating such a lovely project and Mike Bostock for providing examples on how to make your own components.